NextDose: A web-based Bayesian dose forecasting tool
Last updated 16 June 2024
Creating a User Account
NextDose requires you use an email address as a user
name (Figure 1). You will be asked to create a password the first
time you try to login.
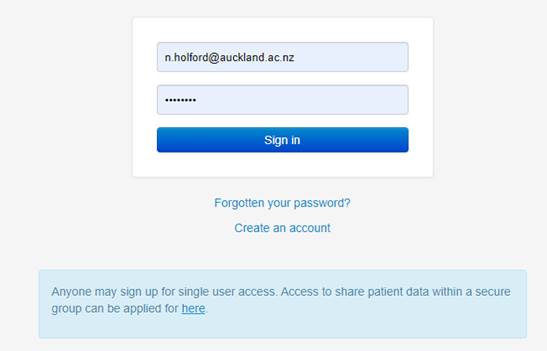
Figure 1
NextDose system administrators do not by default have access to user or
group accounts. Users or group administrators may invite a NextDose
administrator to be a co-administrator to help solve problems.
Creating a Group Account
If you wish to have others have secure access to the same patient data
and results then you can apply to be the administrator
of a group (see link in light blue box in Figure 1). Administrators can modify group details and add
members to the group. All members of the group can see and change data and
execute runs using patient data associated with that group. The data cannot be
seen by anyone outside the group.
Getting Started
The Patient Details page is used to enter a patient identifier and factors
such sex and genotype that do not change with time. Either age at entry or date
of birth may be entered. NextDose derives a date of birth from patient age and
the current date. This date of birth is saved so that current age can be
calculated. If age is less than 1 year then you will
be asked to enter gestation age (enter 40 weeks if you don’t know).
After selecting a medicine you can then enter
basic observations to calculate an initial dosing scheme then enter dose and
response observations to calculate a follow up dosing scheme. Basic
observations include things like weight, height, serum creatinine that may
change with time. They are not response observations like drug concentration or
INR. Basic observations are also known as covariates and response observations
are also known as dependent variables.
There are two fundamental steps (FirstDose, NextDose) when using NextDose. A quick start
overview of the process is shown here:
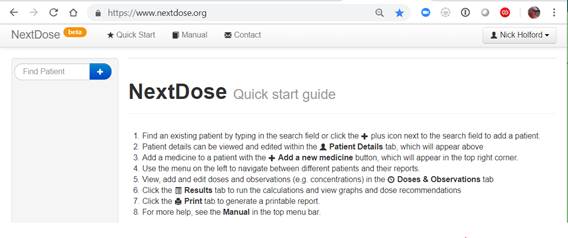
Figure 2
1.
Add
a patient by clicking on the + at the side of the Find Patient box.
2.
Enter
patient details.
3.
Add
a medicine by clicking on the + at the side of the Add a new medicine box.
4.
Add
weight as an observation. Weight is a basic observation that is always
required.
5.
The
FirstDose
step -- predict an
initial dosing scheme by clicking on Results (top menu) and Calculate (blue
button) (use the default choices until you get more comfortable).
a. You will see dosing recommendations
(loading dose and maintenance dose) and a graph of predicted values such as
concentrations.
b. The dosing recommendations and graph
are based on the patient details and basic observations you entered.
6.
Return
to the Doses and Observations page.
7.
Enter
one or more doses.
8.
Enter
one or more response observations such as drug concentration or INR.
9.
The
NextDose step -- predict a follow up dosing
scheme by clicking on Results (top menu) and Calculate (blue button) (use the
default choices until you get more comfortable).
a. You will see dosing recommendations
(loading dose and maintenance dose) and a graph of predicted values such as
concentrations.
b. The dosing recommendations and graph
are based on the doses and the response observations you entered.
10.
Each
time you change the doses, basic or response observations a new instance of the
patient data is created. These can be accessed through the menu of dates and
times on the left hand side of the NextDose window.
Getting Started with Pictures
There are two fundamental steps (FirstDose, NextDose) when using NextDose. An overview
of the process is shown here with screen images:
1.
Add
a patient by clicking on the + at the side of the Find Patient box.
2.
Enter
patient details. Do not select Demo patient unless you wish to share with all
other NextDose users. When finished click Save Changes.
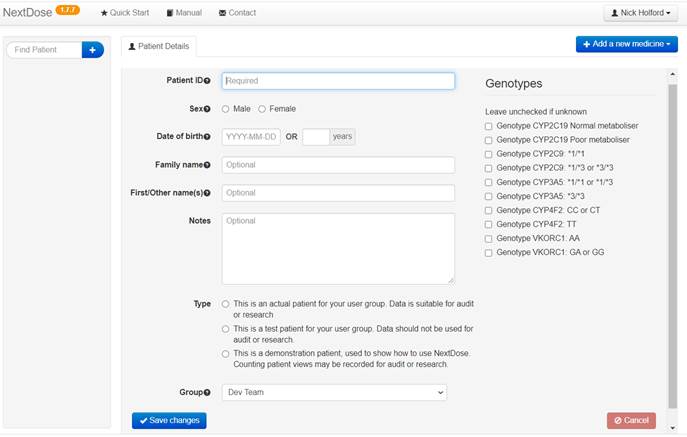
Figure 3
3.
Add
a medicine by clicking on the + at the side of the Add a new medicine box.
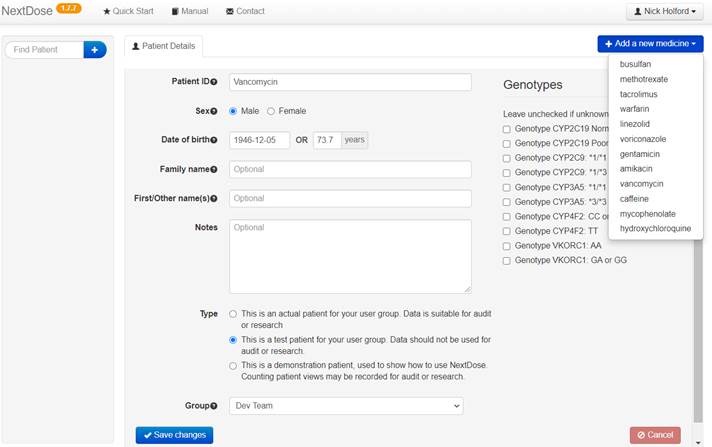
Figure 4
4.
Add
weight as an observation. Weight is a basic observation that is always
required. If height is not entered it will be imputed to help calculate fat
free mass. Try to enter height if you can to improve
size predictions. Always remember to Save changes after entering an Observation
or Dose.
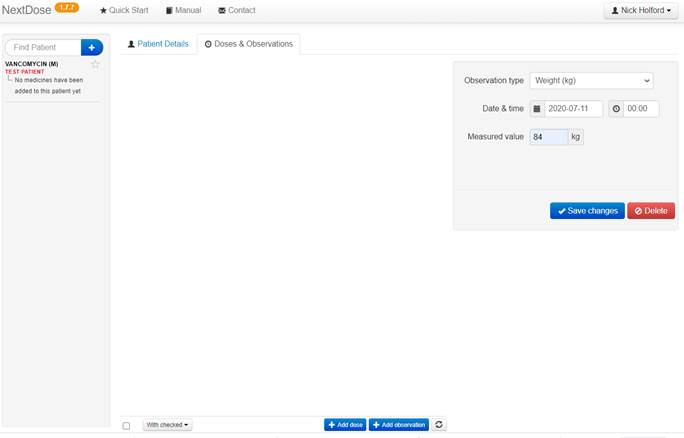
Figure 5
5.
The
Results step -- predict a dosing scheme by
clicking on the Results menu item (top menu). You are offered a set of Dose
Prediction options. Use the default values of the options until you get more
comfortable with using NextDose.
a. The Dose Prediction options are:
i. Model: Choose from a drop down list of alternative models to select a model to
calculate pharmacokinetic parameters and dose predictions.
ii. Target: The target is specified by a
numerical value and a drop down list of target types.
The units of the target value and the type of target are specified by the
target type. Typical types are
1. Average steady state value (Cssavg). If you change the Dose Interval there is no need
to change the target value.
2. AUC specified over the Dose Interval
(AUCssDI). Be careful when using the AUCssDI target type. The Dose Interval
(DI) option will be used as the interval to calculate the target AUC. If you
half the Dose interval from 24 h to 12 h then you should half the target value
e.g. from 400 to 200 mg/L*h to get the same average steady state value with
different dosing intervals.
3. AUC over a pre-defined steady state
interval such as 24 h which does not need to be the same as the Dose Interval
(e.g. AUCss24). If you change the Dose Interval there is no need to change the
target value.
4. Cumulative AUC over an interval such
as 4 days which may include several doses (e.g. Cum AUC 4 days). If you change
the Dose Interval there is no need to change the target value.
5. Steady state value at a specific
time after the dose such as 12 h (e.g. C12h). If you use a Dose Interval that
is the same as this time after dose then the target is
the steady state trough concentration.
iii. Dose Interval: The predicted dose
will is based on the dosing interval specified in this
option. It is recommended to use a Dose Interval that corresponds to the
typical dosing interval you are planning to use.
iv. Calculation Comment: This option can
be used to provide a comment on the dose prediction calculation.
b. Click on Calculate (blue button) to
see the Dose Predictions
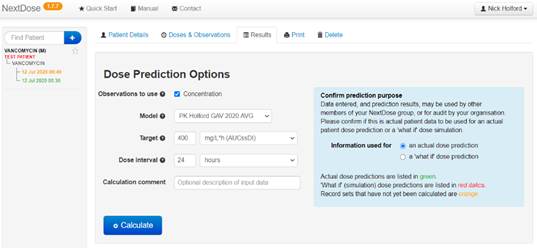
Figure 6
6.
The
FirstDose
step -- predict an initial
dosing scheme by clicking on Results (top menu). You can only use this before
you enter any Dose or Concentration observations in the Doses &
Observations table.
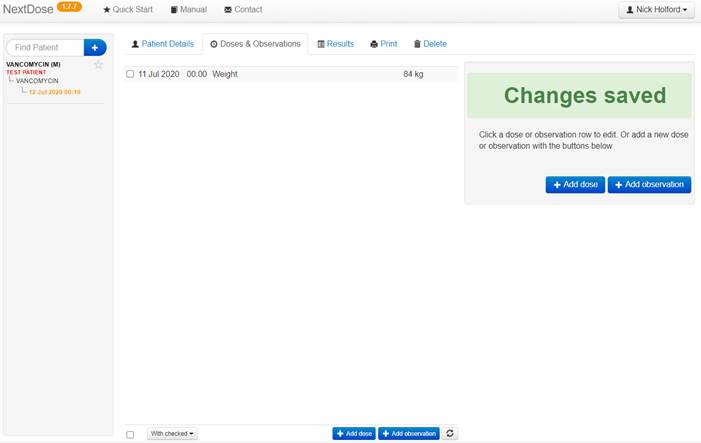
Figure 7
and
Calculate (blue button) (use the default choices until you get more
comfortable). The “What if” option is there so you can explore Dose predictions
and get a visual reminder that the dose calculation was not based on actual
doses and observations.
a.
You
will see dosing recommendations (loading dose and maintenance dose) and a graph
of predicted values such as concentrations. Note that there is a warning about
renal function. This is because no serum creatinine observation was entered and
therefore renal function has been assumed to be 1 (normal for this patient’s
weight and age). If serum creatinine is available it should
be entered as an observation.
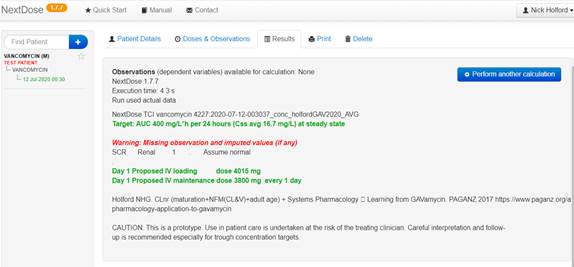
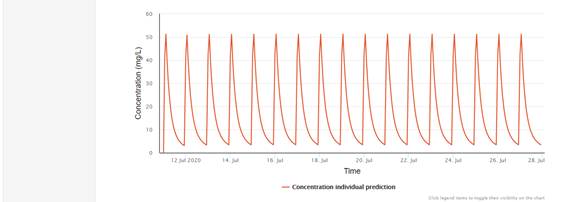
Figure 8
b.
The
dosing recommendations and graph are based on the patient details and basic
observations you entered.
7.
Return
to the Doses and Observations page.
Enter one or more doses. Be sure to enter a suitable date and time for
each dose. When given by infusion you should enter the infusion duration. If
you know a similar dose has been repeated at regular intervals
you can use the Repeat option to specify the number of doses and dosing
interval.
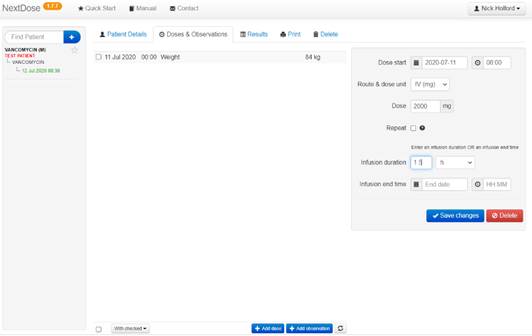
Figure 9
8.
The
NexDose
step – When you have
observations such as drug concentration or INR you can use the Results menu
item to predict doses based on the observations.
a.
Enter
one or more response observations. It is important that you enter the date and
time of the observations correctly relative to the previous dose(s).
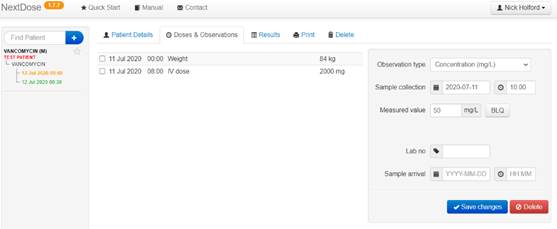
Figure 10
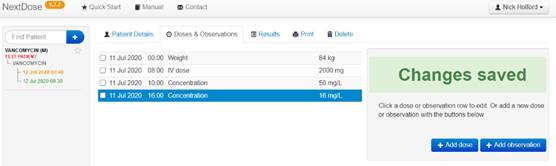
Figure 11
b. Click on the Results menu item.
After a brief calculation delay you will see dosing recommendations
(maintenance dose) and a graph of predicted values such as concentrations. If
you have chosen an AUC target type the steady state average concentration equivalent
to the target AUC and dosing interval is shown as well as the AUC target.
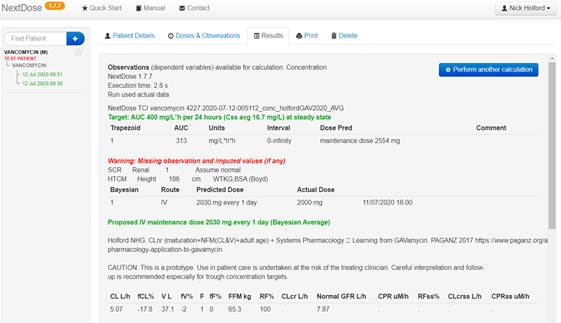
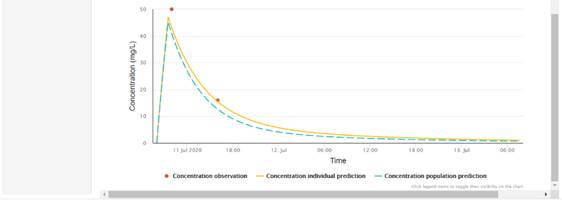
Figure 12
9.
Each
time you change the doses, basic or response observations a new instance of the
patient data is created. Each instance can be accessed through the menu of
dates and times on the left hand side of the NextDose
window. They are colour coded to show instances based
on actual data (green), what if data (red) or changed data that has not been
used for a calculation yet (orange).
Copyright All rights reserved | Developed by Sam Holford & Nick
Holford 2012-2024