NextDose: A web-based Bayesian dose
forecasting tool
Last updated 19 June 2025
Observation Types
The
NextDose Doses and Observations window is used to enter doses and individual
observations such as weight. Observation types such as weight are associated
with a date and time so that time varying changes in these observations may be
used by the NextDose model. When MIC is used as an observation it is treated as
a time varying observation. The new MIC value will be applied to observed doses
and concentrations from the time of the MIC observation.
AUC T1
The AUC T1
observation calculates the area under the curve (~AUC) of the predicted
individual concentration from the AUC starting time (h) entered in the measured
value box. If the starting time is set to “.” the value will be calculated from
the date and time of the observation. The time in hours is counted from the
time of the first observation (dependent variable) or dose in the Doses and
Observations window.
AUC T2
The AUC T2
observation calculates ~AUC from the AUC starting time in AUC T1 and ending at
the time entered in the AUC T2 measured value box. If the starting time is set
to “.” the value will be calculated from the date and time of the AUC T1 or AUC
T2 observation. The time of AUC T2 should be set to a value greater than AUC
T1, otherwise no value for AUC is generated. Multiple pairs if AUC T1 and AUC
T2 may be specified. If an AUC T1 value is specified without an accompanying
AUC T2 then ~AUC will be calculated up to the time of the last predicted
concentration shown on the Results graph.
Hint: Use
AUC occ to see the hours of doses as a guide for selection of AUC T1 and AUC
T2. Both AUC occ and AUC T1 and AUC T2 observations may be used at the same
time.
There are
also observation types that are not time sensitive such as AUC occ. They can be
associated with any date and time and have an effect across the full time
sensitive dosing and observation history. This means you can add AUC occ as an
observation at any date and time. The date and time will be set by default. You
may change the date and time but this does not affect the behavior of AUC occ.
AUC Occ
The AUCocc observation is a signal to NextDose to generate a
table of AUC values calculated after each dose. The date of this “observation”
is unimportant. When present it applies to all doses shown on the Doses and
Observations page. This table
includes the area under the curve (~AUCocc) after each dose occasion until the
time of the next dose based on the predicted individual concentration (Figure 1). The
~AUCocc following the last dose is calculated until the end of the predicted
individual concentration display.
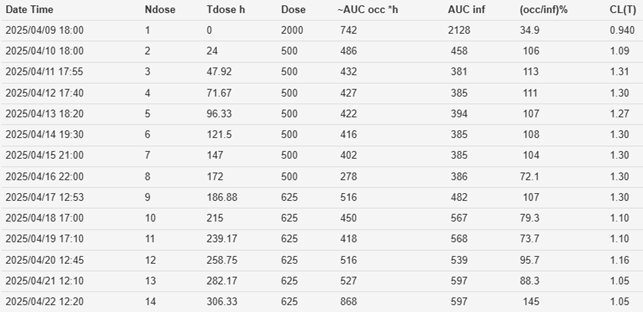
If you look at the AUCocc table (Table 1) you will see estimates of AUC after each dose (~AUCocc). These are numerical approximations to the true AUC after each dose. The “true” AUC can only be estimated (i.e. approximated) by numerical integration. The next column in the table shows AUCinf which is an exact calculation of the AUC from the dose on that occasion from 0 to infinity assuming the clearance estimated for that dose occasion (CL(T) had been constant with regular dosing long enough to reach steady state. The (occ/inf)% column is the % of the AUCinf achieved by each dose.
You may ignore the last dose (e.g. Table 1, Ndose=14) because the AUCocc includes the “tail” of concentrations predicted after the last dose so does not reflect a steady state dosing interval.
Figure 1 Predicted population and individual concentrations
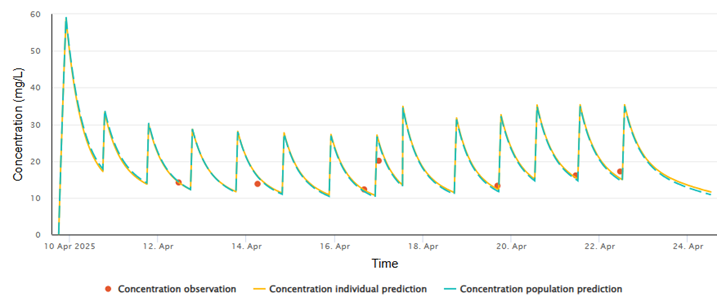
Table 1 AUCocc Table
Note: The
AUC estimates calculated from the predicted individual concentration time
course use a simple integration method with an error of around 5%.
Copyright All rights
reserved | Developed by Sam Holford & Nick Holford 2012-2025